Post by Nicole Blemur, Digital Humanities Project Librarian, July 2026.
I was first introduced to Voyant in December 2024 as a Library Student Assistant by Kayo Denda, the Head of Margery Somers Foster Center and Librarian for Women’s, Gender and Sexuality Studies at Douglass Library. At that time, I created brief cataloging records of materials from the Center for Women’s Global Leadership (CWGL) for the circulating collection at Douglass Library. When all of the books were officially cataloged, the materials were officially configured as the Women’s Rights as Human Rights collection. Another project involving the collection was going to be conducted using Voyant, so I became a bit familiar with the tool, but it wasn’t until I came back in December 2025 as a Digital Humanities Project Librarian that I really familiarized myself with Voyant.
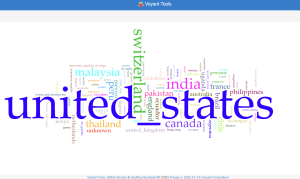
Voyant is a web-based text reading and analysis tool. It’s specifically utilized for “reading and interpretive practices for digital humanities students and scholars as well as for the general public” (Voyant, 2008). The goal of the project using Voyant was to create a visual to properly show the wide range of subjects covered in the CWGL’s materials using the publications’ title fields. There are several visuals Voyant can create—bubblelines, graphs, links, and termsberry. For this project, the word cloud or cirrus as Voyant refers to it as, is what we were interested in. Out of the visuals Voyant creates, the word cloud was the best fit for the project as it displays all of the words it picks up the most in one place. The bubblines and graphs are restricted to the top five words while links and termsberry only show small portions of words within a data set that are connected. To get an idea of what the final visual could look like and to learn how Voyant works, I used other fields gathered from the CWGL cataloging project—publishers, authors, languages, publication dates, and countries of publication. Out of those groups, languages (Figure 1) and publication dates (Figure 2) were the most straightforward visuals. Numbers are easy for Voyant to distinguish and the languages were all single words. The issues started with the authors and the countries of publication. It quickly became clear that Voyant wasn’t able to register anything longer than a single word. For example, it categorized “United States” as two words. It also separated the first and last names of all the authors. Considering how long all of the titles of the materials in the CWGL collection were, this was a very big problem. After putting the titles into Voyant, some of the most prominent words were mainly “a” “it” “the” because those words popped up the most in all of the titles, which isn’t what I was looking for. There were also several phrases that should’ve connected to properly show the frequency of those topics, such as “women’s health” and “women’s rights.” The solution proposed was to use an underscore to connect phrases so Voyant would be able to register them. (Figure 4). This worked well, but the next obstacle was taking out the words not needed and figuring out what to keep. At the time, the only way to filter out those words was to manually go through the document to delete and combine words. For example, “The Montreal massacre” became “Montreal_massacre.” However, it wasn’t always that simple as several titles were very long and contained a variety of subjects. “The United Nations commission on human rights and the different treatment of governments: an inseparable part of promoting and encouraging respect for human rights?” is one of the longer titles, and for the sake of the project was shortened to “United_Nations” and “human_rights.” When that has to be done for over 1,000 titles it takes a good amount of time.
Figure 1: Visual created with Voyant for the languages of materials in the CWGL collection
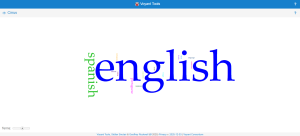
Figure 2: Visual created with Voyant for the years of publication of the materials in the CWGL collection
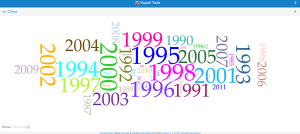
Figure 3: Visual created with Voyant for the countries of publication for the materials in the CWGL collection. Voyant did not recognize “United States” as one entity
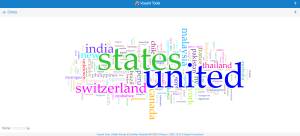
Figure 4: Visual created after using “_” to connect two words
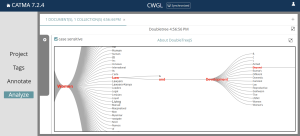
Since the process was taking longer than planned, I decided to see if there were other digital humanities tools I could use. Something important to note is that Voyant isn’t an AI tool, so I wanted to avoid using one as an alternative. The tool I ended up using was CATMA (Computer Assisted Text Markup and Analysis), which is mainly used for annotating text. Unlike Voyant, you do have to create an account to use the tool since it saves projects you’re working on. CATMA does produce a few of the same visuals as Voyant, mainly graphs and word clouds, but the thing that stood out was the Doubletree. It connected words that appeared the most after going through the titles and each time you clicked on one word, it led to several others they were associated with (Figure 5). For example, “women’s” would lead to “rights”, “violence”, “conference”, etc. Since the Doubletree is very big, it’s not possible to take a picture of the full thing to use as a visual to showcase the diversity of the collection, but it’s still a good interactive way to see how words connect to one another. However, despite this cool feature, this tool shared the issue Voyant had in only identifying single words. When trying to use the underscore to resolve the problem, CATMA wasn’t able to register it and glitched. If not for the glitch, it would’ve been a great alternative to Voyant, but since this tool is mainly used for annotations, it’s also understandable why it wasn’t able to register the underscore.
Figure 5: Doubletree of the CWGL titles created by using CATMA
As stated before, I didn’t want to use an AI tool to replace Voyant, but out of curiosity, I decided to try out a few to see how they would do in comparison. Something I didn’t expect while searching for AI tools to test is that most of the tools were behind a paywall. While free trials were offered, it was still required to create an account and list a payment option. There were tools that were free to use, but I wasn’t expecting so many of them to require payments. The nice thing about Voyant is that it’s a free tool that you can use without jumping through any hoops. While I ran into a few issues with CATMA, the tool is also free to use. After searching through more AI tools, quadratic, domo, and tableau are the tools I ended up trying out. Quadratic is an AI spreadsheet that goes through the data users upload and analyzes anything it’s asked, and both domo and tableau created tables and other visuals from uploaded data. None of them were able to register the titles of the CWGL materials. An error resulted in each tool regardless of what I tried. I thought it was because of the titles, so I tried the other sets of data I had just like I did with Voyant. I thought at least the publication years would register, but regardless of what group of data I uploaded, it all resulted in error messages. I was honestly surprised not even one tool worked considering how widely praised AI tools are for being efficient. I also did try to use ChatGPT since it’s the most widely used AI tool, but it wasn’t able to understand the data either. It could just be that AI tools aren’t suitable for a project like this, but it also calls into question if AI is supposed to make things easier, then at least one tool should’ve been successful.
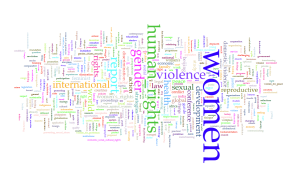
After using CATMA as an alternative didn’t work out, I met with Francesca Giannetti, a Digital Humanities Librarian at Rutgers University about Voyant’s features. The current method of going through each title was very time consuming, so if there was a feature Voyant had that would make the process easier, the next best course of action was to meet with an expert on the tool. In our meeting, she showed me that Voyant does have filters to remove unwanted data. There’s an option for stopwords where you can list words you don’t want Voyant to recognize. It automatically lists words when it creates word clouds and other visuals, but you can also add more words to filter out. The stopwords helped immensely, but adjustments still needed to be made to the actual titles to properly display the different topics in the CWGL collection. I also mentioned using AI tools, and Francesca explained that AI can’t count. Voyant is specifically made for statistics and to count data which is why I ran into so many errors with AI tools. As suspected, for this project, those tools aren’t compatible with the data. After going through all of the titles and adding more stopwords, I reached the final visual to represent the collection (Figure 6). In addition to words such as “women,” and “human rights,” which were expected, the resulting image includes “health” and “domestic violence” which are closely related to women’s human rights, but may not be obvious to the general public. The visual is also a powerful tool to represent specialized collections in digital contents such as blogs and websites. I’m happy with the end result as I think it properly displays the range of subjects the Women’s Rights as Human Rights collection features.
Figure 6: The final word cloud made using Voyant